
Home
/
Technology
Technology
Discover the Power of DNBSEQ™ Technology
A Revolution in DNA Sequencing
Share

The DNBSEQ™ Advantage
Our DNBSEQ™ technology offers several key advantages:
Enhanced Accuracy and Sensitivity in Genomics: DNBSEQ™ technology establishes a new benchmark in NGS accuracy through the innovative application of DNA Nanoballs (DNBs) and rolling circle replication (RCR). This method significantly reduces errors during DNA amplification, ensuring reliable detection of genetic variants, even at low frequencies. The high signal density and minimized systematic errors make it ideal for applications that demand exceptional precision in genomic research.
Optimized Utilization and High Throughput: The patterned array design and efficient DNB loading optimize chip utilization and reagent consumption, not only increasing throughput but also reducing operational costs. This scalability makes DNBSEQ™ suitable for both specialized research projects and large-scale genomic studies, ensuring cost-effectiveness without sacrificing quality.
Advanced Sequencing Technologies: By incorporating Combinatorial Probe-Anchor Synthesis (cPAS), DNBSEQ™ enables rapid, accurate base calling, enhancing the speed of the sequencing reaction. This is further supported by MGI’s proprietary algorithms, including Sub-pixel Registration and GPU-accelerated processing, which improve base call accuracy and data processing speeds, boosting the overall efficiency of the sequencing workflow.
Reduced Amplification Bias: DNBSEQ™ platforms are designed to accommodate a wide array of sequencing needs, from whole-genome and exome sequencing to targeted panel sequencing. This flexibility is invaluable in genetics research, where different studies may require varied sequencing depths and focus areas.
Flexibility in Sequencing Applications: MGI's proprietary Sub-pixel Registration algorithm and GPU accelerated algorithm enable image intensity extraction at the sub-pixel level, greatly improving base call accuracy and dramatically increasing data processing speed.
How DNBSEQ™ Works
MGI's core sequencing technology, called DNBSEQ, is based on DNA nanoballs (DNBs). During library preparation, compact DNBs are created and loaded onto flow cells. The sequence is then read using four fluorescent probes, each recognizing one of the four DNA bases. DNBSEQ employs lasers to excite these probes, capturing millions of images to identify the bases. These clear and bright images are then processed by our proprietary image analysis algorithms to accurately sequence each sample.
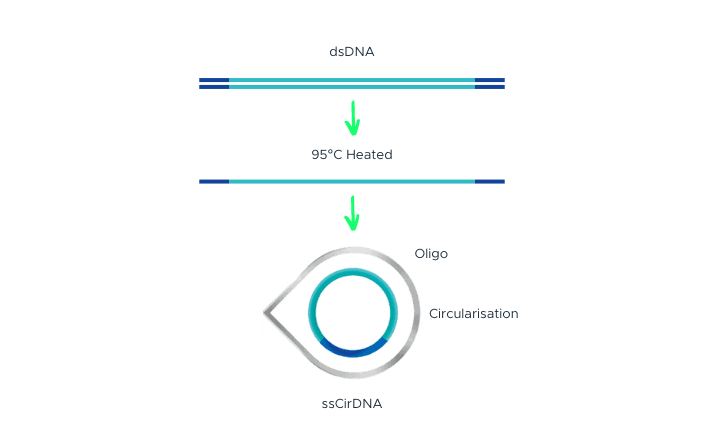
Single-Strand DNA Circularization
Single-strand DNA circularization involves denaturing double-stranded DNA (dsDNA) with adapter sequences at the terminal ends to generate single-stranded DNA (ssDNA). A splint oligonucleotide, which has a complementary sequence to both the 5’ and 3’ terminal ends of one strand of the target dsDNA, hybridizes to these ends of the target ssDNA, forming a nicked circle. The nick is then repaired by DNA ligase, resulting in a single-stranded DNA circle

DNB Making
DNA Nanoballs (DNBs) are produced through Rolling Circle Replication (RCR) using a single-stranded circular DNA template. This process generates 100 to 1,000 copies of DNA fragments, which can be easily quantified before sequencing, eliminating the need for expensive instruments or reagents.
RCR uses a high-fidelity DNA polymerase to ensure that all copies are faithfully replicated from the original DNA template. This approach minimizes the likelihood of errors occurring at the same position across all copies. Furthermore, RCR avoids common issues such as exponential error accumulation, GC biases, and dropouts seen in PCR, leading to improved sequencing accuracy on the DNBSEQ platform.

DNB Loading
Utilizing cutting-edge semiconductor manufacturing techniques, each silicon chip is precisely patterned with binding sites designed to accommodate individual DNA Nanoballs (DNBs). The uniform spacing between active spots prevents overlap in fluorescence signals, resulting in high sequencing accuracy, efficient chip utilization, and optimal reagent usage.
In acidic conditions, the negatively charged phosphate backbones of DNBs are attracted to the positively charged surface of the chip. This electrostatic interaction is essential for the accurate loading of DNBs onto the chip. Proprietary loading buffers enhance this process, ensuring that each active site on the chip binds with only one DNB, thereby preventing signal interference and maximizing the effective spot yield.
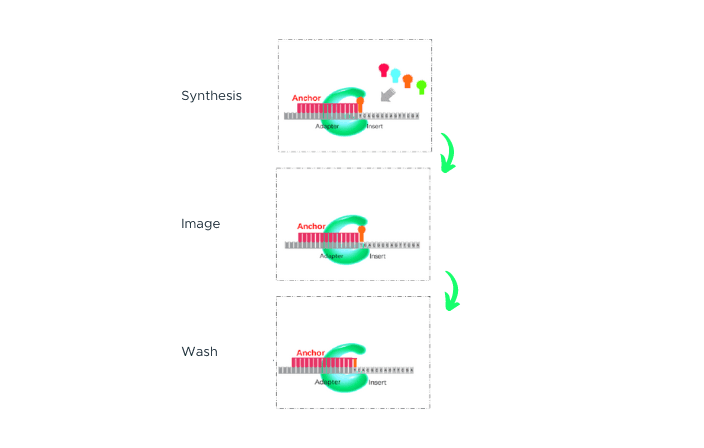
cPAS
After sequencing primers are hybridized to the adapter region of the DNA Nanoball (DNB), a fluorescently labelled dNTP probe is incorporated by a DNA polymerase. Any unbound dNTP probes are then washed away, and the DNB Flow Cell is imaged. The fluorescence signal is converted to a digital signal, and base information is determined using MGI's proprietary base-calling software. After imaging, a regeneration reagent is added to remove the fluorescent dye, preparing the DNBs for the next cycle.
Significant improvements in sequencing biochemistry, along with the identification of a superior sequencing polymerase screened from tens of thousands of mutants, have reduced the sequencing reaction time to less than one minute.

2nd Strand Preparation
After completing the 1st strand sequencing, 2nd strand generation primers and a polymerase with strand displacement activity are added to initiate 2nd strand synthesis. The polymerase extends the new primer until it reaches the originally sequenced strand, at which point it displaces the original strand, forming a new single-stranded template.
This newly generated 2nd strand is optimized to maximize its length while ensuring it remains attached to the original DNA Nanoball (DNB). After the 2nd strand sequencing primer is hybridized, the same sequencing chemistry is used for 2nd strand sequencing as was used for the 1st strand. The new 2nd strand template contains many more copies of insert DNA, resulting in a much stronger signal and increased sequencing accuracy for the 2nd strand.

Base Calling Algorithm
Base calls and base call quality are calculated based on signal intensities from all channels. The relationship between signal characterization and sequencing error is well established through known data models. Predicted sequencing errors for unknown samples are determined based on signal characterization, with quality scores following the Phred-33 standard.
MGI has developed a proprietary Sub-pixel Registration algorithm, which enables image intensity extraction at the sub-pixel level, significantly improving base call accuracy.
Our industry-leading technology has dramatically increased data processing speed and accuracy through the integration of a GPU-accelerated algorithm, optimization of execution efficiency, and real-time image analysis and base calling.